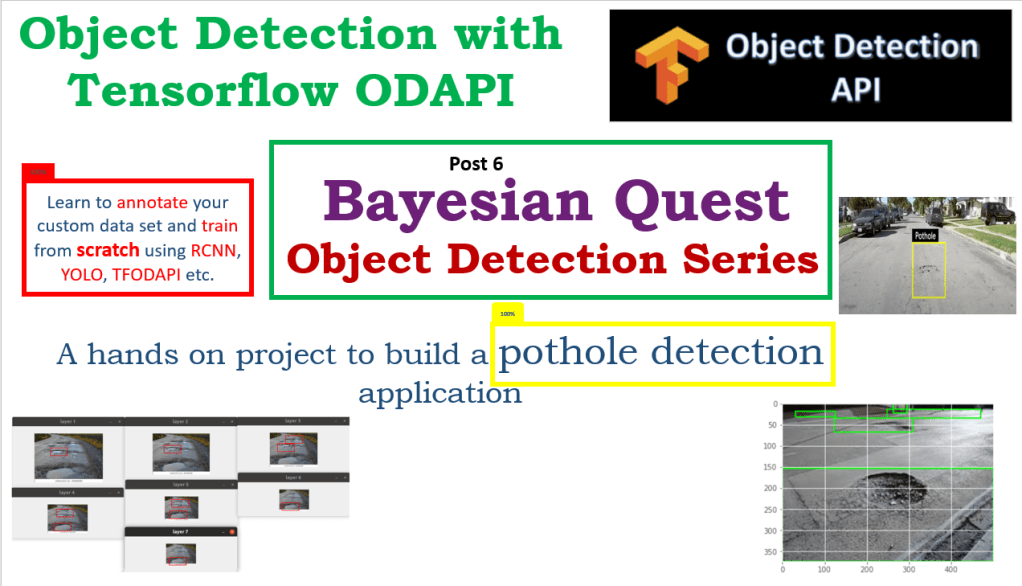
This is the sixth post of the series were we build a road sign and pothole detection application. We will be using multiple methods through out this series which includes computer vision techniques using opencv, annotating images using labelImg, mastering Tensorflow object detection API, Training objection detection using transfer learning, Object detection on video etc. This series will be split across 8 posts.
1. Introduction to object detection
2. Data set preparation and annotation Using LabelImg
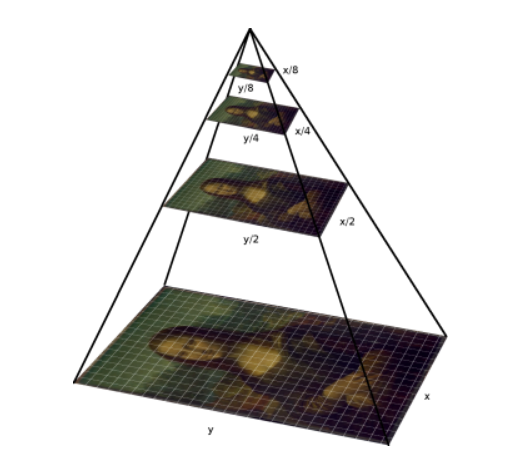
3. Building your object detection model from scratch using Image pyramids and sliding window
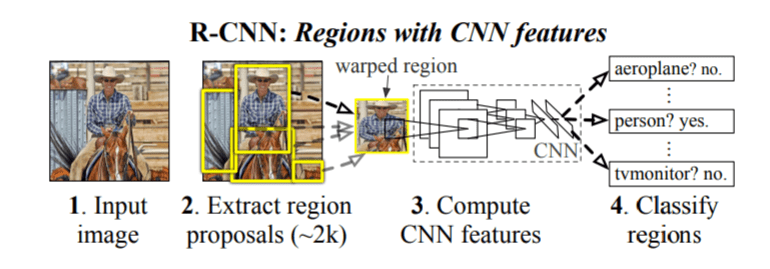
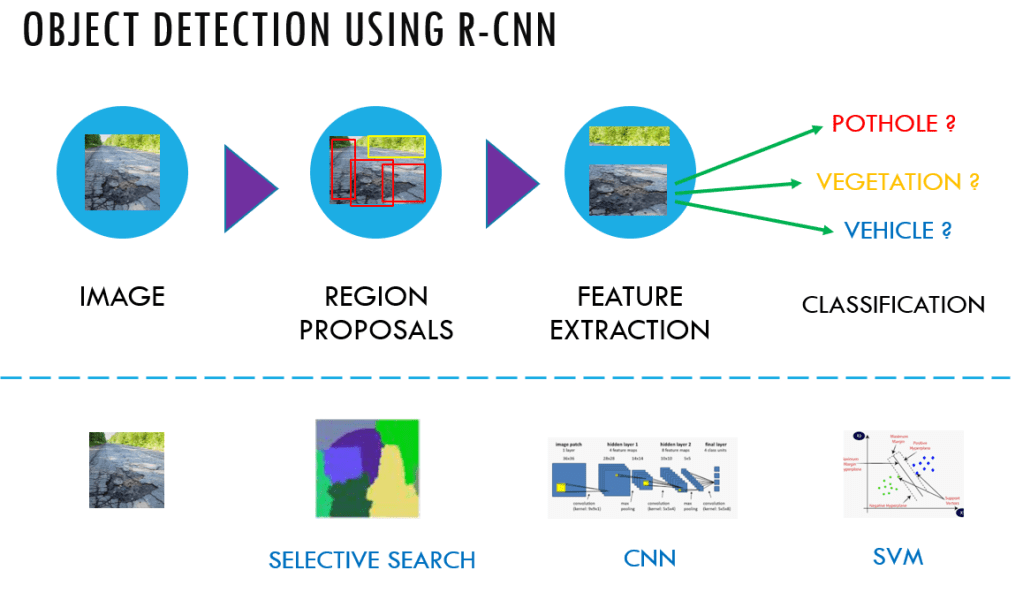
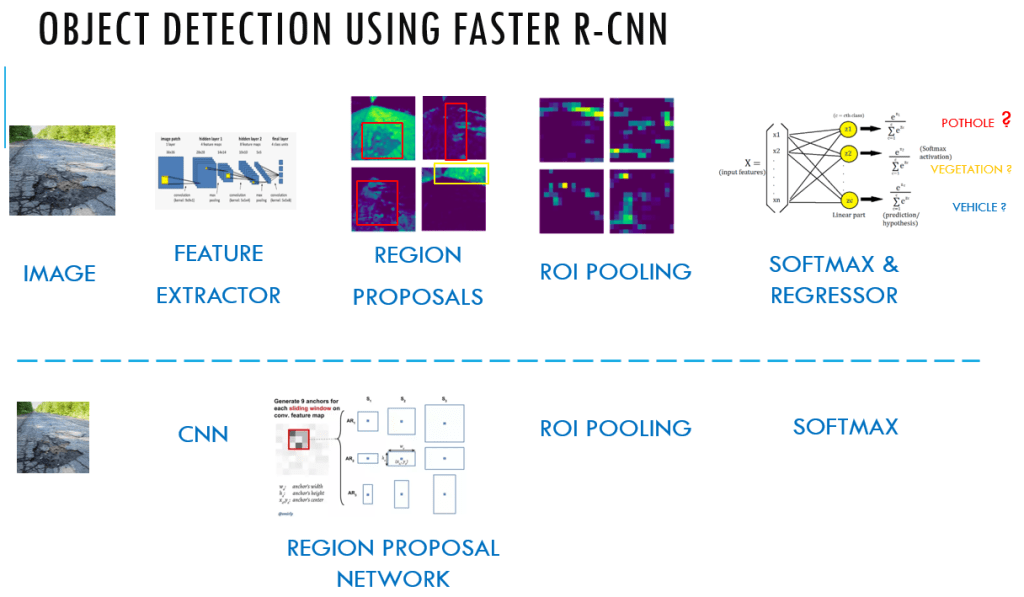
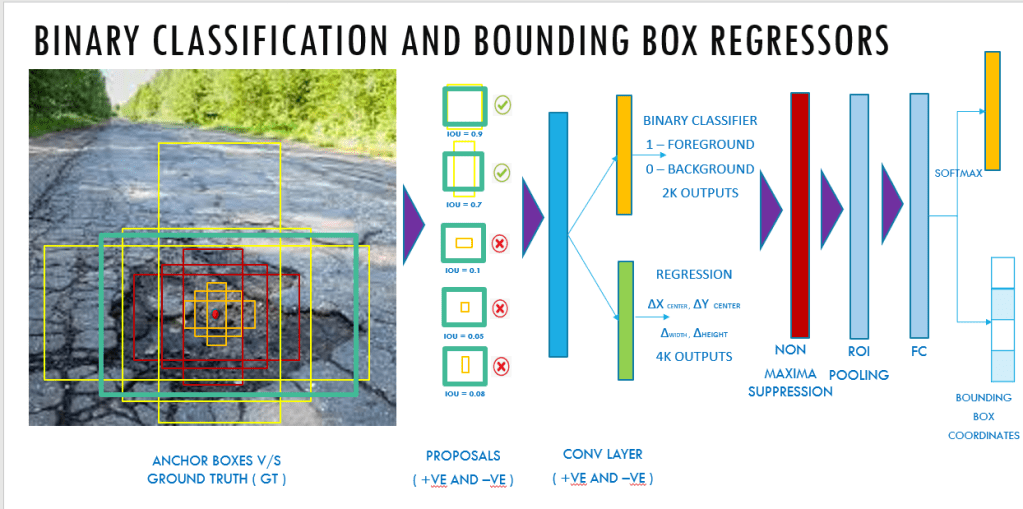
4. Building your road pothole detector using RCNN
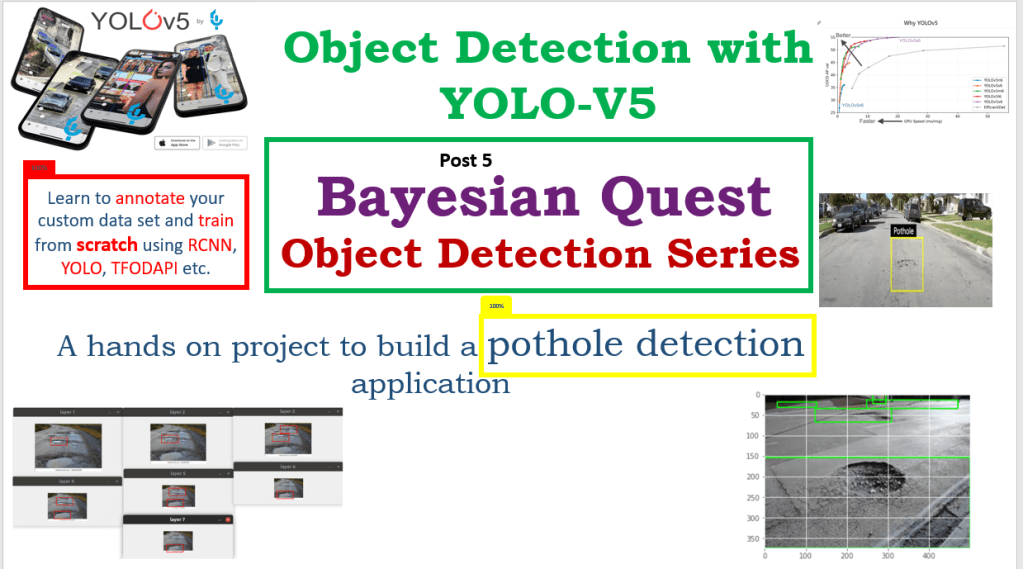
5. Building your road pothole detector using YOLO
6. Building you road pothole detector using Tensorflow object detection API ( This Post)
7. Building your video analytics application for detecting potholes
8. Deploying your video analytics application for detection of potholes
In this post we will discuss in detail the process for training an object detector using the Tensorflow Object Detection API(TFODAPI).
Introduction
Over the past few posts of this series we explored many frameworks through which we created object detection models to detect potholes on road. All the frameworks which we explored till post 5 were about some specific type of model. However in this post we are going to do something different. In this post we will learn about a great utility to do object detection and its called Tensorflow Object Detection API ( TFODAPI ). This is a great API with which we would be able to train custom object detection models using different types of networks. In this post we will use TFODAPI to build our pothole detector. Let us dive in.
Installation of Tensorflow Object Detection API
The pre-requisite for Tensorflow Object Detection is the installation of Tensorflow. To install Tensorflow on your machine you can follow the following link.
Once Tensorflow is installed, we can proceed with the installation of TFODAPI . This installation has 4 major steps.
- Downloading Tensorflow model garden
- Protobut installation / compilation
- COCO API installation
- Install object detection API.
You can do these step wise installation using the following link.
If the installation steps are correct, on testing your installation you should get the following screen
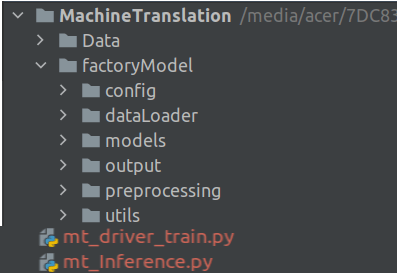
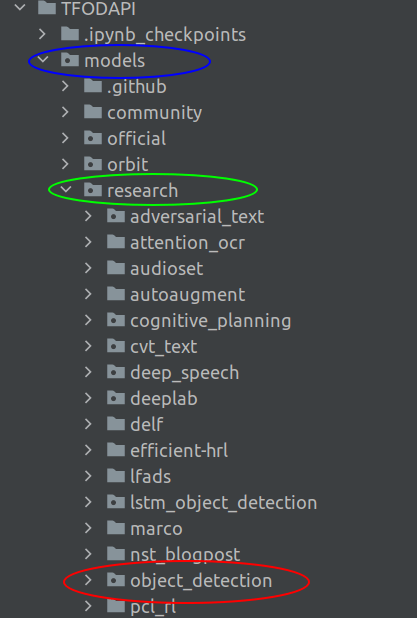
Once all the installations are correct you will have the following folder structure.

Please note that in the installation link provided above, the root folder would be named as 'Tensorflow', however in the installation followed here the root folder is named as 'TFODAPI'. Other than that, the important folder which you need to verify is the /models folder and the other folders created under it. Once this structure is in place, we can get into the next step which is to start the training process using the Custom object detector.
Training a Custom Object detector
Having installed the Tensorflow object detection API, its now the time to get to the training process. In the training process we will be covering the following processes
- Create the workspace for training
- Generate tf records from the annotated dataset
- Configure the training pipeline and monitor progress
- Export the resulting model and use it to detect porholes
Let us start with the first process
Workspace for training
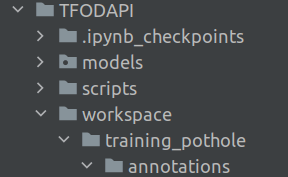
We start off, creating the following sub-folders within our existing folder structure.

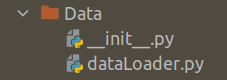
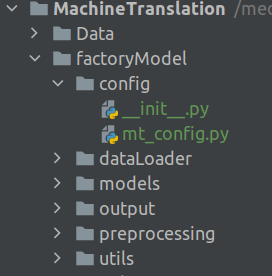
We first create a folder called workspace, under the TFODAPI folder. The workspace folder is where we keep all the training configurations. Let us look at the subfolders of the workspace folder.
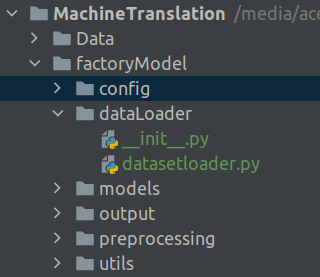
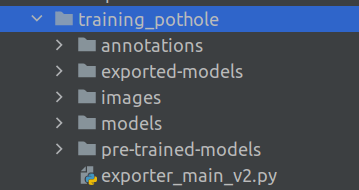
training_pothole : This folder is where the training process gets implemented. Each time we do a training, it is advisable to create a new training_pothole subfolder. This folder has different subfolders under it as follows.
annotations : This folder will contain the train and test data in a format called tf.records. We will see how to create the tf.records in short while.
exported-models :After the training is complete we export the model object to do inference using the train model. This folder will contain the model we will use for inference.
images : This folder contains the raw train and test images which we want to train.
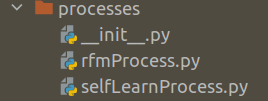
models : This folder will contain a subfolder for each training job we implement. For example, I have created the current training using a ssd_resnet50 model. So you will find a folder related to that as shown in the image below

Once the training is initiated you will have all the training related checkpoints and also the *.config file which contains all the parameters within this subfolder.
pre-trained-models : This folder contains the pre-trained models which we use to initiate our training process. So every type of pretrained model we use will be in a separate subfolder as shown in the image below.
These are the different folders which you will have to create to initiate the training process.
Having seen all the constituent folders within the workspace, let us now get into the training process. As a first step in the training process, let us create the train and test records.
Creating train and test records
Before creating the train and test records, we will have to split the total data into train and test sets using the train_test_split function in scikit learn. After creating the train and test sets, we will move those files inside the train and test folders which are within the images folder. We will do all these processes in the Jupyter notebook.
We will start by importing the necessary library files
import glob
import pandas as pd
import os
import random
from sklearn.model_selection import train_test_split
import shutil
Next let us change our current directory in the Jupyter notebook to the TFODAPI directory. Please note that you will have to give the correct path where your root folder lies instead of the path which is represented here below
!cd /BayesianQuest/Pothole/TFODAPI
Let us also list down all the images we annotated in post 2. We will be using the same set of images in this post.
# List down all the annotated images
random.seed(123)
# Initialize the folder where the annotated images are placed
datafolder = '/BayesianQuest/Pothole/data/annotatedImages'
# List down all the images in the data folder
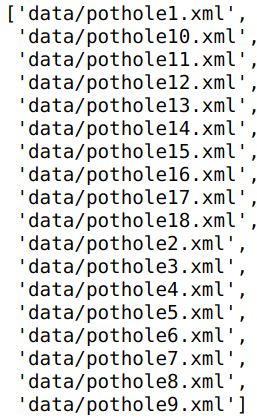
images = glob.glob(datafolder + '/*.jpeg')
print(len(images))
images

As seen in the output, I have taken around 18 images for this process. The number of images you want to use, is your prerogative, more the better.
Let us now sort the images and the split the data into train and test sets.
# Let us sort the images and the split it into train and test sets
images.sort()

# Split the dataset into train-valid-test splits
train_images, test_images = train_test_split(images,test_size = 0.1, random_state = 123)

print('Total train images :',len(train_images))
print('Total test images:',len(test_images))

After having split the data into train and test sets, we need to move the files into the images folder . We need to create two folders under the images folder and name them train and test.
# Creating the train and test folders inside the workspace images folder
!mkdir workspace/training_pothole/images/train workspace/training_pothole/images/test
Now that we have the train and test folders created let us move the files to the destination folders . We will move the file using the below function.
#Utility function to move images
def move_files_to_folder(list_of_files, destination_folder):
    for f in list_of_files:
        try:
            shutil.move(f, destination_folder)
        except:
            print(f)
            assert False
Let us move the files using the above function
# Move the splits into their folders
move_files_to_folder(train_images, 'workspace/training_pothole/images/train')
move_files_to_folder(test_images, 'workspace/training_pothole/images/test/')
Next we will explore the creation of tf records, a format which is required to read data into TFODAPI.
Creation of tf.records file from the images
In this section we will switch gears and then go about executing the next process in python scripts.
When initiating training, we will be using many pre-defined methods and classes which comes with the API. Most of them are within the models/research/object_detection folder in our root folder,TFODAPI, as shown below
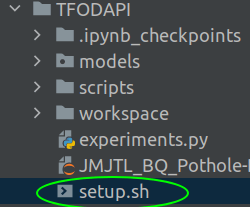
To utilise them in our training and inference scripts, we need to add those paths in the environment. In linux this can be easily be enabled by running those paths in a shell script ( .sh files). Let us first create a shell script to access all these paths.
Open a text editor,create a file called setup.sh and add the following lines in the file
#!/bin/sh
export  PYTHONPATH=$PYTHONPATH:/BayesianQuest/Pothole/TFODAPI/models/research:/BayesianQuest/Pothole/TFODAPI/models/research/slim
This file basically contains the path to the TFODAPI/models/research and TFODAPI/models/research/slim path. The path to the TFODAPI must be changed according to your specific paths. Also please note that you need to have the script export and the paths in the same line.
For Windows system, you can add these paths to the environment variables.
Once the file is created, save that in the folder TFODAPI as shown below
To execute the shell script, open a terminal and the execute the following commands

There will not be any message or output after executing this script. You will be returned to your terminal prompt after execution.
This will ensure that all the paths are entered as environment variables.
Creation of label maps
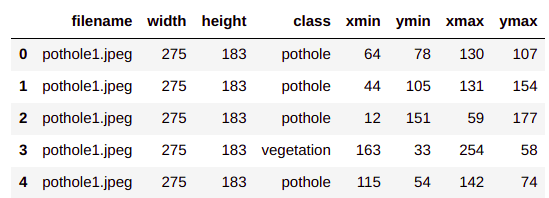
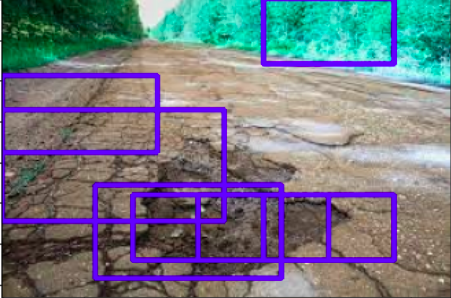
TFODAPI requires a label map, which maps each of the labels to an integer value. This label map is used both by the training and detection processes. The mapping is based on the number of classes we have in the pothole_df.csv file we created in post2 of this series.
# Reading the csv file
pothole_df = pd.read_csv('../pothole_df.csv')
pothole_df.head()

pothole_df['class'].unique()

To create a label map open a text editor, name it label_map.pbtxt and include the below mapping in that file.
item {
    id: 1
    name: 'pothole'
}
item {
    id: 2
    name: 'vegetation'
}
item {
    id: 3
    name: 'sign'
}
item {
    id: 4
    name: 'vehicle'
}
This has to be placed in the folder ‘annotation’ in our workspace.

Creation of tf.records
Now we have all the required files to create our tf.records. Let us open the text editor, name it generate_tfrecord.py and insert the following code.
import os
import glob
import pandas as pd
import io
os.environ['TF_CPP_MIN_LOG_LEVEL'] = '2'    # Suppress TensorFlow logging (1)
import tensorflow.compat.v1 as tf
import argparse
from PIL import Image
from object_detection.utils import dataset_util, label_map_util


# Define the argument parser
arg = argparse.ArgumentParser()
arg.add_argument("-l","--labels-path",help="Path to the labels .pbxtext file",type=str)
arg.add_argument("-o","--output-path",help="Path to the output .tfrecord file",type=str)
arg.add_argument("-i","--image_dir",help="Path to the folder where the input image files are stored. ", type=str, default=None)
arg.add_argument("-a","--anot_file",help="Path to the folder where the annotation file is stored. ", type=str, default=None)

args = arg.parse_args()

# Load the labels files
label_map = label_map_util.load_labelmap(args.labels_path)
label_map_dict = label_map_util.get_label_map_dict(label_map)

# Function to extract information from the images
def create_tf_example(path,annotRecords):
    with tf.gfile.GFile(path, 'rb') as fid:
        encoded_jpg = fid.read()
    encoded_jpg_io = io.BytesIO(encoded_jpg)
    image = Image.open(encoded_jpg_io)
    width, height = image.size
    # Get the filename from the path
    filename = path.split("/")[-1].encode('utf8')
    image_format = b'jpeg'
    # Get all the lists to store the records
    xmins = []
    xmaxs = []
    ymins = []
    ymaxs = []
    classes_text = []
    classes = []
    # Iterate through the annotation records and collect all the records
    for index, row in annotRecords.iterrows():
        xmins.append(row['xmin'] / width)
        xmaxs.append(row['xmax'] / width)
        ymins.append(row['ymin'] / height)
        ymaxs.append(row['ymax'] / height)
        classes_text.append(row['class'].encode('utf8'))
        classes.append(label_map_dict[row['class']])
    # Store all the examples in the format we want
    tf_example = tf.train.Example(features=tf.train.Features(feature={
        'image/height': dataset_util.int64_feature(height),
        'image/width': dataset_util.int64_feature(width),
        'image/filename': dataset_util.bytes_feature(filename),
        'image/source_id': dataset_util.bytes_feature(filename),
        'image/encoded': dataset_util.bytes_feature(encoded_jpg),
        'image/format': dataset_util.bytes_feature(image_format),
        'image/object/bbox/xmin': dataset_util.float_list_feature(xmins),
        'image/object/bbox/xmax': dataset_util.float_list_feature(xmaxs),
        'image/object/bbox/ymin': dataset_util.float_list_feature(ymins),
        'image/object/bbox/ymax': dataset_util.float_list_feature(ymaxs),
        'image/object/class/text': dataset_util.bytes_list_feature(classes_text),
        'image/object/class/label': dataset_util.int64_list_feature(classes),
    }))

    return tf_example


def main(_):

    # Create the writer object
    writer = tf.python_io.TFRecordWriter(args.output_path)
    # Get the annotation file from the arguments
    annotFile = pd.read_csv(args.anot_file)
    # Get the path to the image directory
    path = os.path.join(args.image_dir)
    # Get the list of all files in the image directory
    imgFiles = glob.glob(path + "/*.jpeg")
    # Read each of the file and then extract the details
    for imgFile in imgFiles:
        # Get the file name from the path
        fname = imgFile.split("/")[-1]
        # Get all the records for the filename from the annotation file
        annotRecords = annotFile.loc[annotFile.filename==fname,:]
        tf_example =  create_tf_example(imgFile,annotRecords)
        # Write the records to the required format
        writer.write(tf_example.SerializeToString())
    writer.close()
    print('Successfully created the TFRecord file: {}'.format(args.output_path))
if __name__ == '__main__':
    tf.app.run()
Lines 1-9, we import the necessary library files and in lines 13-19 we define the arguments.
In line 14, we define the path to the label map file ( .pbtxt ) file we created earlier
We define the path where we will be writing the .tfrecord file in line 15. In our case this is the path to the annotations folder.
The next argument we provide in line 16, is the path to the images folder. Here we give either the train folder or test folder.
The final argument, in line 17 is the path to the annotation file i.e pothole_df.csv file.
Next task is to process the label mapping file we created. For processing this file we use two utility functions which are part of the Tensorflow Object detection API, which we imported in line 9. After the processing in line 23, we get a label map dictionary, which is further used in creation of the tf.records files.
In lines 26-67, is a function used for extracting features from the images and the label maps to create the tf.record. Let us look at the function
The parameters to the function are the following
path : This is the path to the image we are going to process
annotRecords : This is the row of the pothole_df.csv file which contains information of the image and the bounding boxes in that image.
Moving on inside the function lines 26-29 implements a module tf.io.gfile for reading the input image file. This module provides an API that is close to Python’s file I/O object. TensorFlow exports these objects as tf.io.gfile, so that you can use these implementations for saving and loading checkpoints, writing to TensorBoard logs, and accessing training data.
In lines 30-31, the image is opened and its dimensions are read.
The filename is extracted from the path in line 33 and in line 34 the file format is defined.
Lines 36-49, extracts the bounding box information in the respective lists and also stores the class name in the string format and also the numerical format from the label map.
Finally in lines 51-63, all these information extracted from the images and its class names are stored in a format called tf.train.Example. Once these information are packed in the tf.train.Example object it gets written to the tf. record format. That takes us to the end of the function and now we will see the complete process , where this function will be called to extract information from the images.
Lines 72-89, is where the process gets executed. Let us see them line by line.
In line 72, the writer is defined using the TfRecordWriter() method and is written to the output folder to the .record format ( for eg. train.record / test.record)
We read the annotation csv file in line 74 and then extracts the path to the image directory in line 76 and lists down all the the image paths in line 78.
We then iterate through each of the image path in line 80 for further feature extraction within the iterative loop.
We extract the file name from the path in line 82 and the get all the annotation information for the file from the annotation csv file in line 84
We extract all the information of the file in line 85 using the create_tf_example() function we saw earlier and get the tf_example object. This object is finally written as a string in the .record in line 87
The writer object is closed after all the image files are processed.
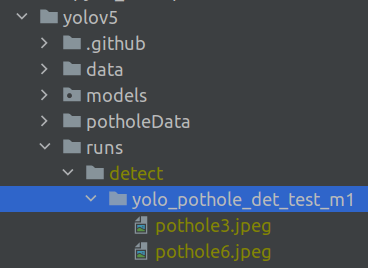
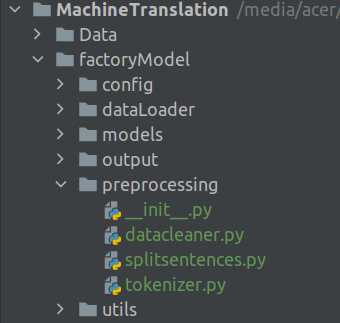
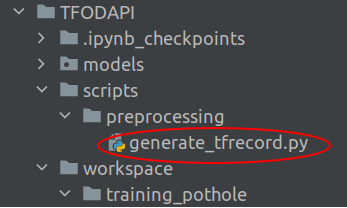
We will save the generate_tfrecord.py in the scripts/preprocessing folder as shown below
To run the file, we will open a terminal and then execute the command in the following format.
$ python generate_tfrecord.py -i [path to images folder] -a [path to annotation csv file] -l [path to label map .pbtxt file] -o [path to the output folder where .record files are written]
For example

Need to run this command for both the train images and test images seperately. Need to change the path of the files folder and also .record name based on whether it is train or test. Once these scripts are executed you will find the train.record and test.record files in the annotation folder as shown below.

That takes us to the end of train and test record processing steps. Next we will start the training process.
Training the Pothole Detection model using pre-trained model
We will not be training the model from scratch, rather we would be fine tuning a pre-trained model for our purpose. The pre-trained model we will be using would be SSD ResNet50 V1 FPN 640×640. These pre-trained models are available in TensorFlow 2 Detection Model Zoo. Later on I would encourage you to implement the same detector using a Faster RCNN model from this repository.
We start our training process by downloading the model we want to implement from the TensorFlow 2 Detection Model Zoo.

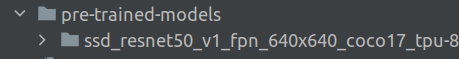
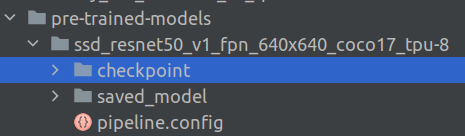
Once we click on the link, a .tar.gz file gets downloaded to your local drive. Extract the contents of the tar file and then move the complete folder into the folder pre-trained-models. Since we extracted the model SSD ResNet50 V1 FPN 640×640, our folder, pre-trained-models will have the following structure.
The more models you want to download, you need to maintain seperte folder structure for each of the model you want to use. I have downloded the Faster RCNN model also, and now the structure looks like the following.

Creating the training pipeline
After unloading the contents of the model to the pre-trained models folder, we will now create a new folder under the folder workspace/training_pothole/models and name it my_ssd_resnet50_v1_fpn and then copy the pipeline.config file from the folder pre-trained-models/ssd_resnet50_v1_fpn_640x640_coco17_tpu-8 and place it in the new folder my_ssd_resnet50_v1_fpn you created. Now the structure will look like the below.
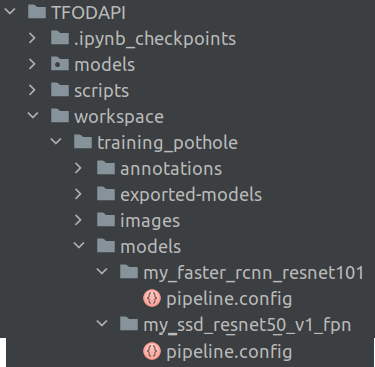
Please note that I also have faster_rcnn model here. So for each model you download the structure will look like the above.
Now that we have copied the pipeline.config file, we will have to make changes to the file to cater to our specific purpose.
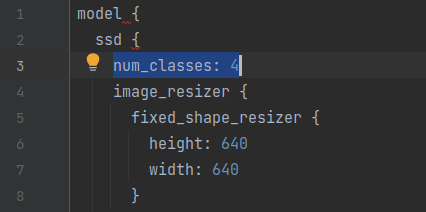
- Change 1 : The first change we have to make is in line 3 for the number of classes. We need to change the number of classes to 4
- Change 2 : The next change is in line 131 for the batch size. Depending on the number of examples, you need to change the batch size.

- Change 3 : The next optional change is for the number of training steps as in line 152 and 154. Depending on the configuration of your machine you can change it to the number of steps you want to train the model.
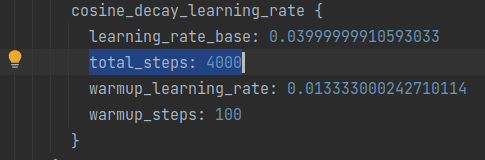
- Change 4 : Path to the check point of the pre-trained model in line 161

- Change 5 : Change the fine tune checkpoint type to “detection” from the default “classification'” in line 167

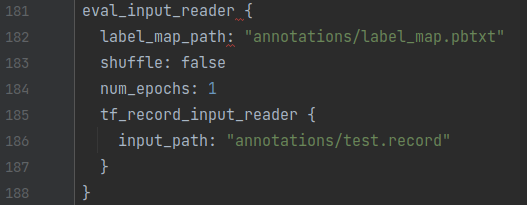
- Change 6 : label_map_path and train record paths , line 172 and 174

- Change 7: label_map_path and test record paths, line 182 and 186
Now that the config file is customised, its time to start our training process.
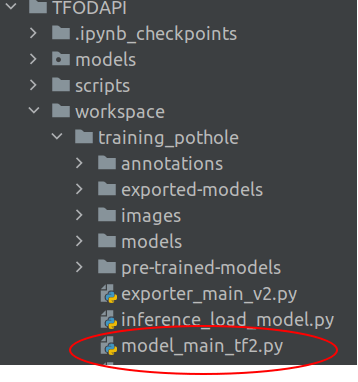
Training the model
We have a script which is part of the API to do the training. This can be copied from the folder TFODAPI/models/research/object_detection/model_main_tf2.py. This needs to be placed in the training_pothole folder as shown below.
We are all set to start the training of our model. To start the training, you can change directory to the training_pothole folder and enter the following command on the terminal.
python model_main_tf2.py --model_dir=models/my_ssd_resnet50_v1_fpn --pipeline_config_path=models/my_ssd_resnet50_v1_fpn/pipeline.config
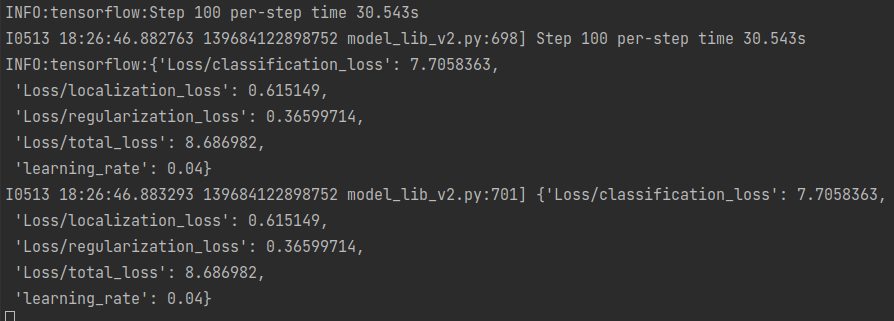
Training is a time consuming process. Depending on the speed of your computer it might take hours to complete. The process might seem stuck as not output would be printed for a long time. However you need to be patient and wait for it to complete. The metrics will be printed every 100 steps, as shown in the output above.
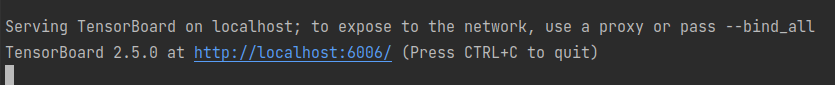
You will be able to monitor the training process using Tensorboard. You need to open a terminal, change directory to training_pothole and then enter the following command in the terminal

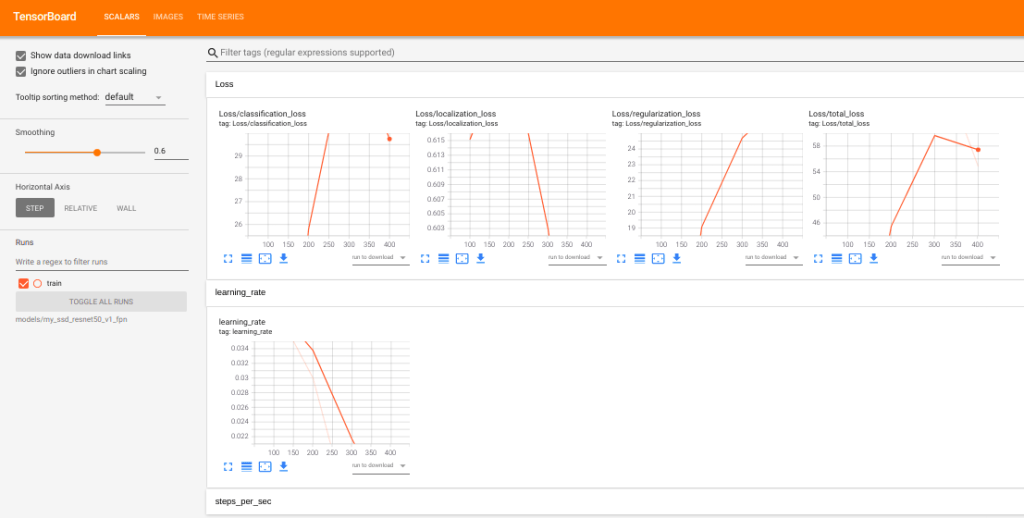
You will get the following output and tensorboard will be active on port 6006
Once you click on the link for the port 6006, you will see metrics like the below on tensorboard.
Once training is complete you will find a sessions folder called train and the checkpoints created inside my_ssd folder.

We now need to export the trained models for the inference process. This means that the model object is exported from the latest checkpoint to a new folder from which we will do our predictions.
To get this done, we first need to copy the file, TFODAPI/models/research/object_detection/exporter_main_v2.py and then paste it inside the training_pothole folder.
Now open a terminal change directory into training_pothole, directory and then enter the following command.
python exporter_main_v2.py --input_type image_tensor --pipeline_config_path models/my_ssd_resnet50_v1_fpn/pipeline.config --trained_checkpoint_dir models/my_ssd_resnet50_v1_fpn/ --output_directory exported-models/my_model
You will now see the model object and the checkpoint information in the exported-models/my_model folder.

We can now initiate the inference process after this.
Inference Process
Inference process is where we test the model on new images. We will implement the inference process using a new script. The code for the inference step is heavily inspired from the following link
Open your text editor, create an new file and name it inference_load_model.py and add the following code into it.
import time
from object_detection.utils import label_map_util
from object_detection.utils import config_util
from object_detection.utils import visualization_utils as viz_utils
from object_detection.builders import model_builder
import os
os.environ['TF_CPP_MIN_LOG_LEVEL'] = '2'    # Suppress TensorFlow logging (1)
import tensorflow as tf
import numpy as np
from PIL import Image
import warnings
warnings.filterwarnings('ignore')   # Suppress Matplotlib warnings
import glob
First we import all the necessary packages. Packages from lines 2-5, are downloaded from the API code we downloaded. These will be available in the object detection folder.
Next we will define some of the paths to the exported model folder.
# Define the path to the model directory
PATH_TO_MODEL_DIR = "exported-models/my_model"
PATH_TO_CFG = PATH_TO_MODEL_DIR + "/pipeline.config"
PATH_TO_CKPT = PATH_TO_MODEL_DIR + "/checkpoint"
Lines 16-18, we define the paths to the model we exported, the config file and the model checkpoint. These information will be used to load the model for predictions.
We will now load the model using the check point information.
print('Loading model... ', end='')
start_time = time.time()

# Load pipeline config and build a detection model
configs = config_util.get_configs_from_pipeline_file(PATH_TO_CFG)
model_config = configs['model']
detection_model = model_builder.build(model_config=model_config, is_training=False)

# Restore checkpoint
ckpt = tf.compat.v2.train.Checkpoint(model=detection_model)
ckpt.restore(os.path.join(PATH_TO_CKPT, 'ckpt-0')).expect_partial()

end_time = time.time()
elapsed_time = end_time - start_time
print('Done! Took {} seconds'.format(elapsed_time))
We load the model in line 26 and restore the checkpoint information in lines 29-30.
Next we will see two utility functions which will be used in the inference cycle.
@tf.function
def detect_fn(image):
    """Detect objects in image."""
    image, shapes = detection_model.preprocess(image)
    prediction_dict = detection_model.predict(image, shapes)
    detections = detection_model.postprocess(prediction_dict, shapes)

    return detections

def load_image_into_numpy_array(path):
    """Load an image from file into a numpy array. """
    return np.array(Image.open(path))
The first function is to generate the detections from the image. Line 39, the image is preprocessed and we do the prediction in line 40 to get the prediction dictionary. The prediction dictionary consists of different elements which are required to create the bounding boxes for the objects. In line 41, the prediction dictionary is preprocessed to get the final detection dictionary which again consists of the elements required for bounding box creation.
The second function in lines 45-47 is a simple one to convert the image into an np.array.
Next we will initialise the labels and also get the path of the test images in lines 49-53
# Get the annotations
PATH_TO_LABELS = "annotations/label_map.pbtxt"
category_index = label_map_util.create_category_index_from_labelmap(PATH_TO_LABELS,use_display_name=True)
# Get the paths of the images
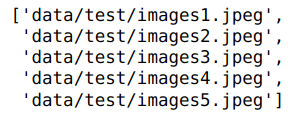
IMAGE_PATHS = glob.glob("BayesianQuest/Pothole/data/test" + '/*.jpeg')
We now have all the components to start the inference process. We will iterate through each of the test images and then create the bounding boxes. Let us see the complete process for that now.
for image_path in IMAGE_PATHS:
    print('Running inference for {}... '.format(image_path), end='')
    # Convert image into a np array
    image_np = load_image_into_numpy_array(image_path)
    # Convert the image array to a tensor after expanding the dimension to include batch size also
    input_tensor = tf.convert_to_tensor(np.expand_dims(image_np, 0), dtype=tf.float32)
    # Get the detection
    detections = detect_fn(input_tensor)
    # Get all the objects which were detected
    num_detections = int(detections.pop('num_detections'))
    detections = {key: value[0, :num_detections].numpy()
                  for key, value in detections.items()}
    detections['num_detections'] = num_detections
    # detection_classes should be ints.
    detections['detection_classes'] = detections['detection_classes'].astype(np.int64)
    # Create offset for labels for visualisation
    label_id_offset = 1
    image_np_with_detections = image_np.copy()
    # Visualise the images along with the bounding boxes and labels
    viz_utils.visualize_boxes_and_labels_on_image_array(
            image_np_with_detections,
            detections['detection_boxes'],
            detections['detection_classes']+label_id_offset,
            detections['detection_scores'],
            category_index,
            use_normalized_coordinates=True,
            max_boxes_to_draw=200,
            min_score_thresh=.45,
            agnostic_mode=False)
    # Show the images with bounding boxes
    img = Image.fromarray(image_np_with_detections, 'RGB')
    img.show()
We iterate through each of the test images in line 55 and then get the detections in line 62 after all the necessary pre-processing in the previous lines.
In the pipeline.config file we defined that the maximum total objects to be 100 ( line 104 of pipeline.config file). Therefore all the elements in the detection dictionary will cater to 100 objects. However the total objects we detected could be far less that what was initialised. So for the next processes, we only need to take those objects which were detected by the model. Lines 64-69, implements the steps for selecting only those objects which were detected.
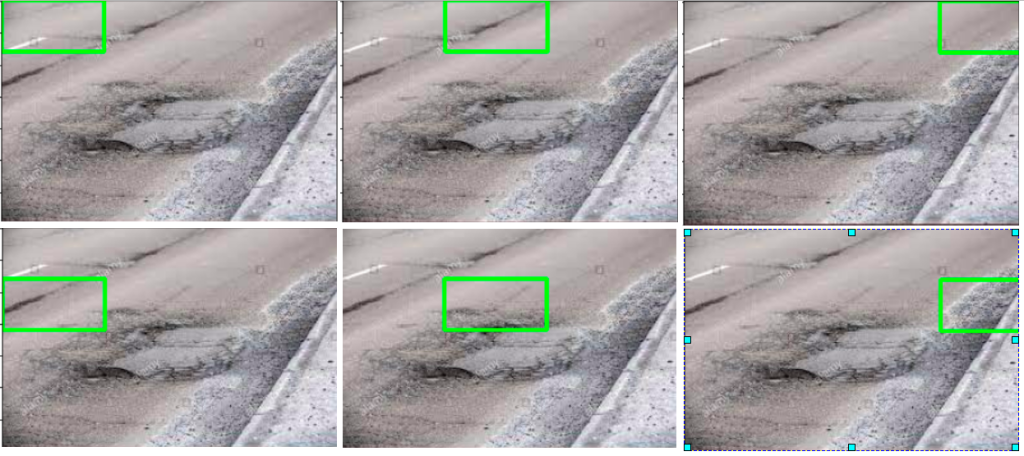
Once we get only the objects which were detected, its time to visualise the objects along with the bounding boxes and the labels. These steps are implemented in lines 71-86. In line 82, we are specifying a threshold for accepting any objects. Only those objects whose score is greater than the threshold will be visualised.
To implement the script, open the terminal and enter the following command

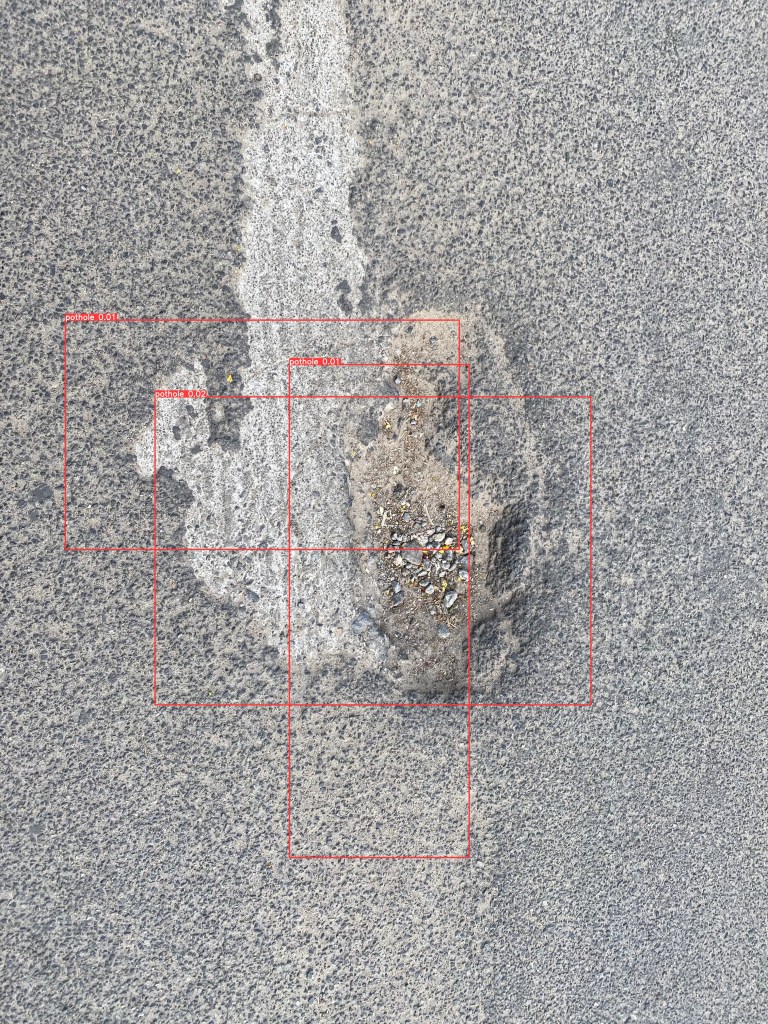
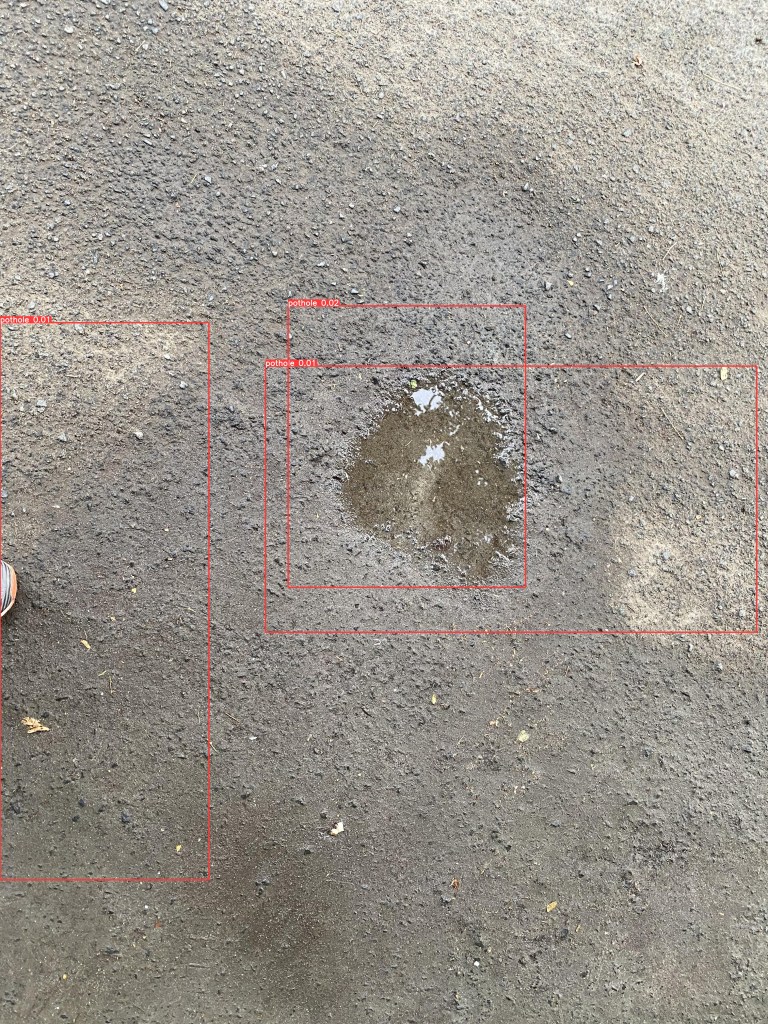
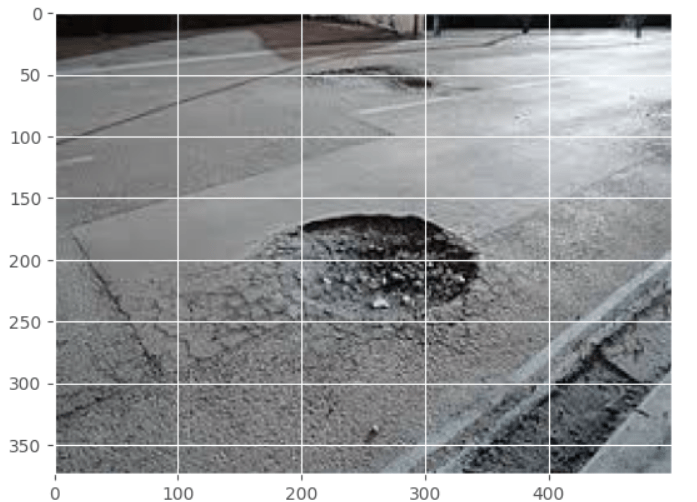
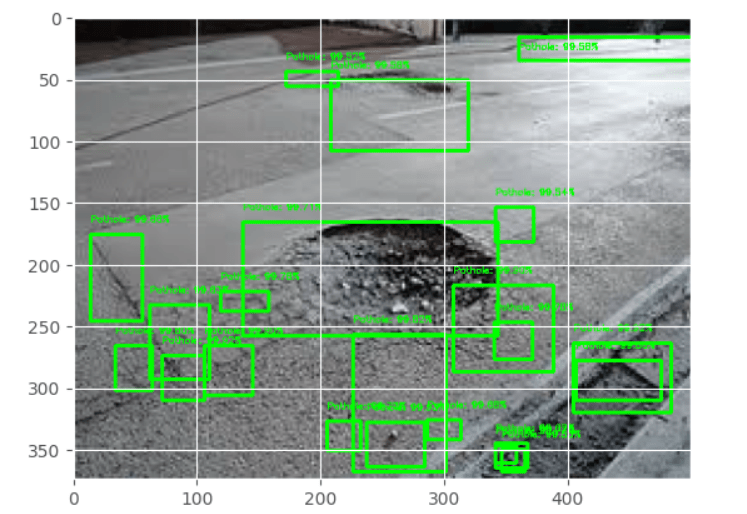
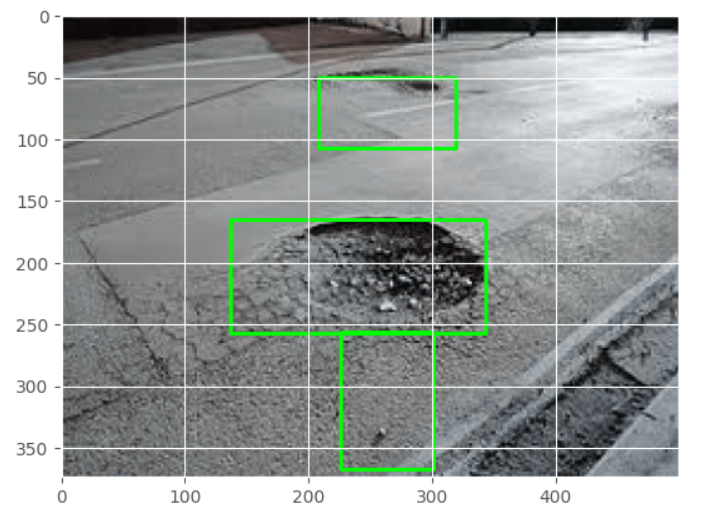
You should see outputs similar to the below after this script is run.

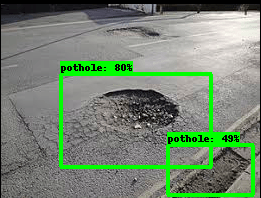
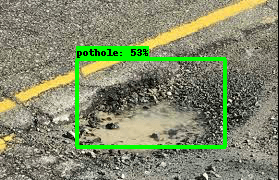
We can see that the there are some good localisations for the potholes. All these were achieved with very limited images. With more images and better pre-processing techniques, we will be able to get much better results from what we have got now.
What Next ?
So far in this series we have seen different frameworks for object detection. We started with legacy methods like image pyramids and then explored more robust methods like RCNN and YOLO. Finally in this post, we learned to implement object detection using a great utility, Tensorflow Object Detection API. Now we will move ahead from what we have learned so far. The next step is to apply the techniques we learned in some real world scenarios like using it to analyze video files. That will be our endeavor in the next post. To be notified of the next post please subscribe to this blog post .You can also subscribe to our Youtube channel for all the videos related to this series.
You can also access the code base for this series from the following git hub link
Do you want to Climb the Machine Learning Knowledge Pyramid ?
Knowledge acquisition is such a liberating experience. The more you invest in your knowledge enhacement, the more empowered you become. The best way to acquire knowledge is by practical application or learn by doing. If you are inspired by the prospect of being empowerd by practical knowledge in Machine learning, subscribe to our Youtube channel
I would also recommend two books I have co-authored. The first one is specialised in deep learning with practical hands on exercises and interactive video and audio aids for learning

This book is accessible using the following links
The Deep Learning Workshop on Amazon
The Deep Learning Workshop on Packt
The second book equips you with practical machine learning skill sets. The pedagogy is through practical interactive exercises and activities.

This book can be accessed using the following links
The Data Science Workshop on Amazon
The Data Science Workshop on Packt
Enjoy your learning experience and be empowered !!!!