

In the last post of this series we had a glimpse into the nuances of the business discovery and data engineering phases. These phases dealt with breaking down a business problem into the factors which influence the problem and collating data points related to the business problem. In this post, we will go further as to how the data we collected is further analysed to give us insights into our modeling process. This phase is called the data discovery phase.
Data Discovery Phase
This phase is one of the most critical phases in the whole life cycle where one gets acclimatized with the data structure and the inter relationships between the variables. There are two perspectives as to how we approach the data discovery phase. One perspective is the business perspective and the second is the statistical perspective. Both these perspectives can be depicted as follows.

The business perspective deals with relationship between the variables from the domain of the business problem. In contrast the statistical perspective will look more on the statistical characteristics of the data at hand like its distributions, normality,skew etc. To help us elucidate these concepts let us take a case study.
Let us assume that a client of ours who have various cell sites approaches us with a problem they are grappling with. They would like to know in advance the state of health of the batteries which are powering their cell sites. They want our help in predicting when their batteries would fail. For this they have given us historical data related to the measurements they have taken over time. Some of the key variables involved are readings related to conductance, voltage, current, temperature, cell site location etc. Our client has also given us some clues as to what might constitute the failure of a battery. They have asked us to look at trends where the conductance values show precipitous fall over time which might be an indicator of failing batteries. Equipped with these information let us see how we can go about our task of data discovery. Let us first look at it from the business perspective.
Data Discovery – Business Perspective
The best way to embark the data discovery phase is to think from the perspective of our business problem. Our business problem was to predict the impending failure of batteries. The obvious question which comes to our mind is what constitutes failure of batteries ? We might not have a clear cut recipe for failure at this point of time however what we have is a trail which we have to follow. The trail we have, is that of batteries which show a trend of dropping conductance over time. To follow this trail we need to first separate those batteries with falling trend from those which do not show that trend. The next question would be how do we separate out those batteries which have a falling trend from the rest ? The best way to do that is to go for some aggregating metric for the basic unit connected with our business problem. Let me elaborate the last sentence by going into a pictorial representation of our data set.

Let the sample of the data we have at hand be as shown in the figure above. We have number of batteries, say around 20,000 of them. For each battery we have readings of conductance over a time period of around 2- 3 years. Each battery is associated with a plant ( cell location) . A plant may have multiple batteries however a battery will be associated with only one plant.
Now that we have seen the structure of our data set let us come back to the earlier statement i.e. ” aggregating metric for the basic unit connected with the business problem“. Looking at this statement there are two main terms which are important.
- Basic unit &
- Aggregating metric.
In our case the basic unit connected with the business problem are the individual batteries themselves. If our business problem were to predict plant sites which can potentially fail, then our basic unit would be each plant site. Talking about the second term, the aggregating metric, it is an aggregated measure of variable associated with the basic unit under consideration. In our case it would be some aggregation of the conductance of each battery. Again the type of aggregation metric would depend on the business problem. So let us take a step back into the problem we set out for ourselves. We were concerned about identifying the batteries which had a falling trend. The more pronounced the falling trend, more likely for it to be a failing battery. So when we think about an aggregating metric we should think about a metric which will accentuate the spread of data. A very handy metric to represent the spread of data would be the standard deviation. So if we aggregate the values of each battery by taking the standard deviation of its conductance we have a very effective method to identify the set of batteries we want. The same is represented in the plot below.
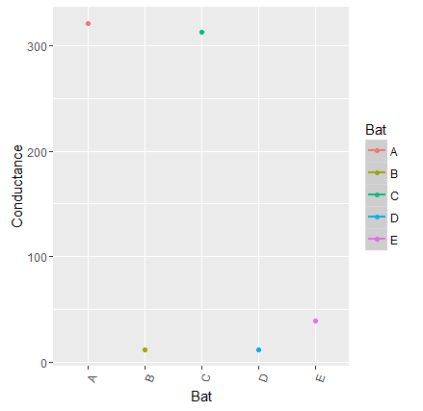
The above figure is a plot of the batteries along x axis and the standard deviation of conductance along y axis. We can clearly see that using our aggregating metric we clearly have two groups of batteries, one with standard deviation less than 100 and the other with more than 300. The second group i.e batteries A & C whose standard deviation is way above the rest are potentially the cases we are looking for. Let us also try and plot the real conductance value of these batteries over time to corroborate our hypothesis.
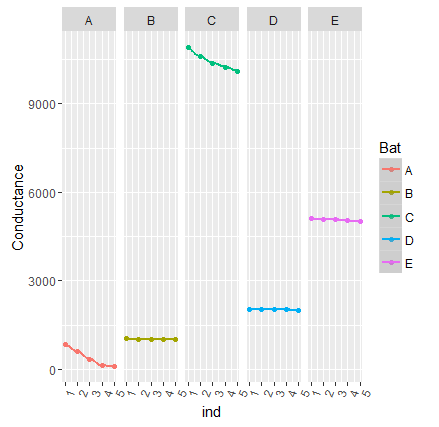
We can clearly see from the above plot that battery A & C shows a dropping trend which was indicated by the high standard deviation for these batteries. So taking an aggregating metric like this will help us in zeroing on to the cases where we want to further dig our hands into.
Deep Diving
Now that we have identified our set of batteries which potentially could be problematic, the next step is to dive deep into those cases and try to identify other indicators which are associated with falling conductance. We need to look closely at some pictorial representation of the data and then ask further questions
- Are there any period of time when such trends are happening ?
- Are there any specific patterns which we can unearth before the falling trend in conductance
- Are there any thing special about the slope of the curve which shows a falling trend… etc
We need to look at all discernible patterns within that variable and build our intuitions on them. Once we build our intuitions on one variable it is time to move further and associate other variables. We can bring in variables like voltage, current, temperature etc and see how they behave with respect to the specific trends which we saw when we analysed only one variable (Conductance) . Some of the trends we can look at are the following
- How has voltage, current or temperature behaved during the period when we saw a drop in conductance ?
- Are there any specific trends for these variables before we saw the trend in falling conductance ?
- How have these variables behaved after the fall in conductance values ?
- Are there any prospects for any more variables other than the ones we have ? … etc
These are the kind of questions we have to ask to help us in unearthing various relationships which exists within the variables in our data set. Asking all these questions and slicing and dicing into each of the variables help us achieve the following
- Helps in determining relative importance of variables
- Provides a rough idea about relationships between variables
- Gives insights into any variables that needs to be derived out of the existing variables
- Gives us intuitions on any new variables which needs to be brought in
All insights we unearth by asking such questions will help us immensely when we get into the downstream modelling activities.
Summing Up
Now that we have seen the business perspective of the data discovery phase, let us encapsulate the main steps in the process
- Identify a variable which potentially give indication of the problem we are trying to solve
- Derive some aggregation metric for the identified variable to help us split the basic unit related to our problem
- Dive down deep into cases we have earmarked and look for trends with respect to the variable we are looking for
- Introduce other variables and look for association of the newly introduced variables with the trends we saw in the first variable.
- Look for relationship between variables which give clues to the problem statement
- Build intuitions on any new variable that can be introduced which can help in solving the problem.
The above are a set of broad guideline as to how we can structure our thought process for business perspective of the data discovery phase. In the next post we will deal with the statistical perspective of data discovery and how we can connect the dots between both these perspectives so as to give us intuitions for feature engineering and modelling. Watch out this space for more.

What about the part III?
LikeLike
Will publish it within the next 2 weeks Kleyn. Apologies for the long break.
LikeLike